Whether you’ve just closed a staff wellbeing survey or gathered parent feedback trust-wide, you now face the big question: What do we do with this data?
Analysing results is one of the most critical, but often overwhelming, steps in the Strategic Feedback Survey Cycle outlined in Edurio’s Stakeholder Feedback Hub (p. 6–7). This cycle moves schools and trusts from isolated data points to evidence-informed improvement:
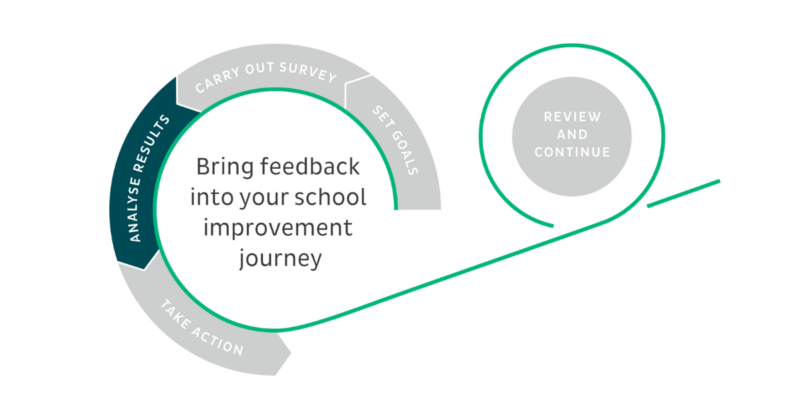
Source: Edurio Stakeholder Feedback Hub
Find out more about each step on the links below.
This blog post focuses on Step 3: Analyse results, guiding you through a clear, 7-step process drawn directly from Edurio’s nationally recognised approach. These steps will help you extract insight from survey data and use it to spark meaningful conversations and action.
A 7-step roadmap for analysing survey results in schools and trusts
Stakeholder surveys, whether from staff, pupils or parents, offer a wealth of information. However, their true value lies in how effectively education leaders interpret and apply the insights. Without a structured approach, data can feel overwhelming, leading to missed opportunities or surface-level fixes that don’t drive meaningful improvement.
This 7-step guide will help you move beyond collection to confident, evidence-informed analysis.
Step 1
Find the positive
Start by identifying what is working well. Recognising strengths allows schools and trusts to celebrate successes and maintain effective strategies.
🎯Key actions:
- Review high-scoring areas to determine what practices are yielding positive outcomes.
- Identify which respondent groups provided the most favourable feedback.
- Avoid making assumptions and dig deeper to understand why certain areas perform well.
A positive-focused approach sets a constructive tone for further analysis.
🚀 Pro tip: Here are the six basic questions to ask at this step of analysing survey results.
- Which areas are the strongest?
- Which areas are the weakest?
- Which respondent group has the highest results?
- Which respondent group has the lowest results?
- Are there any surprising results?
- What are the most important results?
Source: Stakeholder Feedback Hub, page 42
Step 2
Face the negative with an open mind
Low scores or critical feedback present opportunities for growth.
🎯Key actions:
- Identify areas that received the lowest ratings.
- Consider which stakeholder groups provided critical feedback and explore why.
- Avoid jumping to conclusions—gather additional insights before determining next steps.
An objective, open-minded approach to negative feedback fosters constructive problem-solving.
Source: Stakeholder Feedback Hub, pages 42-43
Step 3
Look out for surprising results
Unexpected positive or negative findings may highlight misalignments between perception and reality.
🎯Key actions:
- Compare results to past survey data or external benchmarks to determine if trends are consistent.
- Discuss surprising results with leadership teams and staff to gain different perspectives.
- Investigate whether external factors (e.g., policy changes, school events) influenced responses.
A proactive response to surprising data points helps address underlying causes and improves decision-making.
Source: Stakeholder Feedback Hub, page 43
Step 4
Understand open response answers
Open-ended responses offer deeper insights into stakeholder experiences.
Common methods for analysing free-text responses include:
- Thematic coding: Group responses by common themes to identify key issues.
- Word clouds: Visualise frequently mentioned terms to detect patterns.
- AI or manual categorisation: Use AI tools or manual review to classify responses efficiently.
Open-ended responses provide context for quantitative survey results and highlight areas requiring further attention.
Source: Stakeholder Feedback Hub, pages 43-44
Step 5
Check the reliability of the data
Strong survey data is representative and reliable.
🎯Key actions:
- Review response rates: A high response rate ensures data validity.
- Assess sample sizes: Ensure that respondent groups are proportionally represented.
- Identify response bias: Some groups may be overrepresented or underrepresented.
Validating the reliability of the data strengthens confidence in the insights derived.
Source: Stakeholder Feedback Hub, pages 44-45
Step 6
Consider the most important results to take further
Prioritise key insights that align with strategic goals.
🎯Key actions:
- Focus on findings that impact staff, pupils, or parents most.
- Identify areas that require immediate action versus long-term improvements.
- Ensure that conclusions are relevant, actionable, and based on solid evidence.
Data-driven decision-making helps education leaders implement meaningful change.
Source: Stakeholder Feedback Hub, pages 46-47
Step 7
Make it a team effort
Collaborative data analysis strengthens trust-wide engagement.
🎯Key actions:
- Engage leadership teams, staff and key stakeholders in reviewing results.
- Organise discussions or workshops to refine interpretations and develop action plans.
- Ensure buy-in from key decision-makers to support the implementation of improvements.
By involving multiple perspectives, schools can ensure a balanced and well-informed approach to interpreting survey data.
Source: Stakeholder Feedback Hub, pages 47-48
Putting your survey results into context
Once you’ve identified strengths, challenges, and surprises in your survey data, it’s time to understand what the results really mean for your school or trust.
To do this well, look beyond the numbers. Consider other data sources, such as attendance records, safeguarding reports or staff turnover trends, that could help explain or reinforce what you’re seeing in the survey. This kind of triangulation adds depth and reliability to your conclusions.
Next, explore how your results compare across schools in your trust or against national benchmarks. A score might seem low in isolation, but if it’s consistent with wider trends, it may reflect a system-level challenge. Conversely, standout strengths can offer valuable learning to share across your organisation.
Finally, consider your local context. Consider what’s been happening within your community—new leadership, policy changes, or external pressures—and how that might have shaped the responses. These contextual insights are key to interpreting feedback fairly and turning it into meaningful action.
You can find more detail on how to contextualise your survey results in the Analyse Results section of the Stakeholder Feedback Hub, pages 45–48.
Beyond analysis: how to use your findings
While this blog post focuses on analysis, Edurio’s full guide continues through the final stages of the feedback cycle: Taking Action and Reviewing Progress. You’ll find practical templates for setting priorities, planning actions, communicating results, and tracking long-term change on pages 51–60 or here.
Download the Stakeholder Feedback Hub Digital PDFHow Edurio supports trust and school leaders
✅ The UK’s largest trust benchmarking dataset – Compare performance across schools, trusts, and national trends.
✅ Bespoke trust-wide insights – Understand staff wellbeing, pupil engagement, and trust effectiveness across multiple schools.
✅ Data-driven strategy – Move from raw data to targeted actions that create lasting change.