
How to Use a Survey to Support your Staff Wellbeing Strategy
Staff retention is a growing challenge within schools, therefore school and trust leaders are increasingly turning to staff feedback to help understand where they should focus their efforts. Our recent report on, Staff Retention in Academies gathers 4 years worth of staff experiences to help demonstrate the outlook of school staff across England. Below, we look at how gathering such experiences in a survey can help your staff wellbeing strategy.
Through gathering data on staff experience, leaders can gain a clear overview of how their school or trust is functioning, and identify strengths and areas of improvement. 96% of CEOs surveyed by Edurio and the Confederation of School Trusts in March 2022 reported they already collect staff feedback as part of their overarching people strategy. Despite this effort, trusts are struggling to assure their staff that their voices are heard. When we asked staff, ‘How often do you see that the feedback to the school leadership has an impact?’ only 28% felt that an impact could be seen always or often.
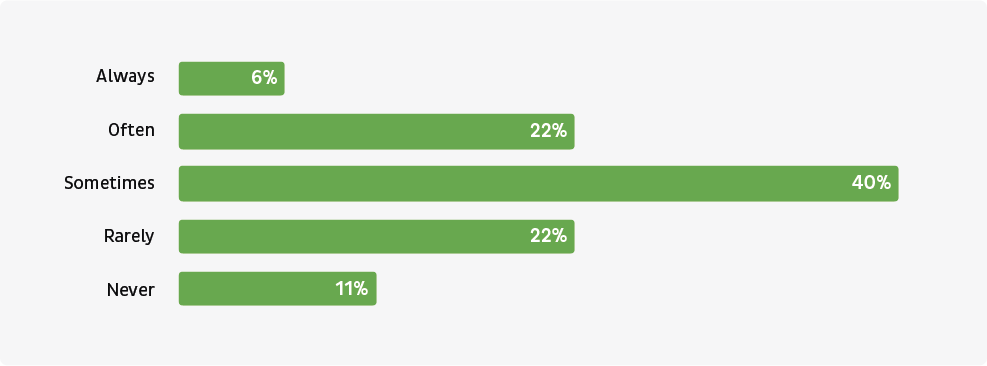
How often do you see that your feedback to the school leadership has an impact?
With the majority of CEOs surveyed understanding they need to hear about staff experience and over a 100 trusts now running our staff experience survey across over 25k staff members every year, school leaders understand that feedback matters. Yet, with only a third of staff feeling their impact makes a difference, there is an opportunity for more.
As a trust leader, to get the most out of your staff feedback, it’s important to consider how the data fits within the wider strategic goals of your trust. We believe that the way to improve this is to commit to the long run, review how you analyse the results to get to the hidden insights, and involve your organisation during this feedback process.
So, in this post, we’ll focus on how to use a survey to support your staff wellbeing strategy by creating a survey, learning how to understand the data it produces and how to use it afterward. We’ll use examples from our national report findings, customer case studies, and insights from our platform to illustrate how you can achieve better staff engagement in your trust.
1) Commit to The Long Run with Your Staff Wellbeing Survey
It is easy to treat a survey as a tool to collect information and measure satisfaction every once in a while. However, in our work with trusts, we’ve found that truly benefitting from staff feedback requires a continuous effort over multiple years. It is not easy within the whirlwind of school leadership. Still, we have seen that by using an initial review of the situation to inform decisions, then monitoring to track improvements over time, you can ensure you’re focusing on what matters most to staff while also driving deeper engagement.
Initial Review Informing Decisions
By committing to the long run through continuously surveying and gathering the experience of your staff, you’ll be able to track what improves, what needs improvement, and where to take focused action.
Treating your first survey as an opportunity to understand the experience through the eyes of your staff, you ensure you are focusing in the right places. If you discover that staff are happy with the overall leadership dynamics at your trust, but feel less positive about communication, then you may decide to alter your communication style, channels, and frequency over the next year in an attempt to improve the overall staff experience.
Our partner trusts find this approach incredibly useful. In a recent case study, Michael Cowland of CovMAT stated that our recommended approach has enabled their trust to be more strategic regarding people planning – allowing them to lead by evidence rather than by our assumptions about what staff experience.
By making stakeholder feedback a core part of your people planning strategy, you can be more confident that your efforts are focussed on the areas that matter most to your staff.
Monitoring and Improving Over Time
Consistently running a survey doesn’t just help you understand where to focus your initial attention, it also helps you gain long-term data for evaluation over time. Asking the same questions across multiple years helps you track progress and see which areas your interventions have had a positive impact and which need further attention, or even the impact of external factors on your staff experience.
When speaking to our partner trusts, we have learnt that by doing a survey year on year and making improvements related to the data they were collecting. One trust reported that such an initiative has consistently improved trust perception among staff members over the years.
In this graph, (which contains example data) we can see the difference between responses received across two years in the same trust. Based on feedback collected a year ago, they had identified issues with staff support and relationships, the peer-based support available in the trust, and developed an action plan focussed on this area.
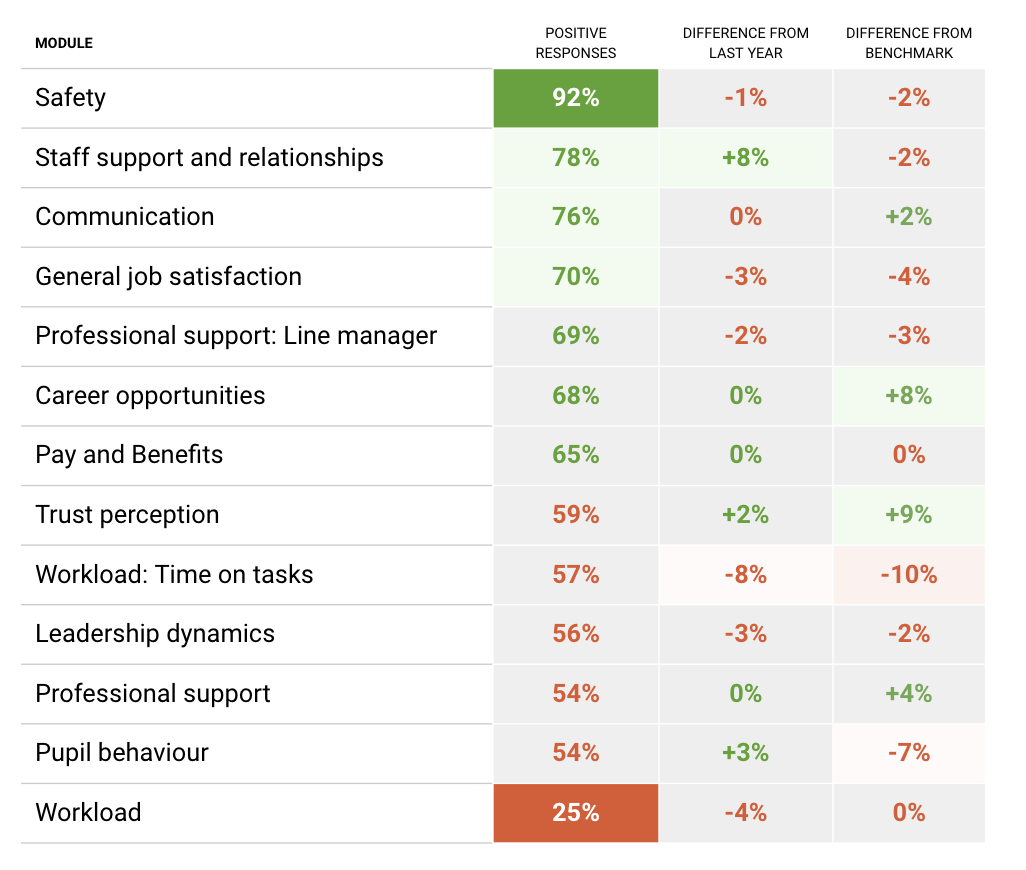
Platform screenshot with example data
While most scores are in line with last year, we can see improvements in staff support and relationships, which suggests that their action plan was working. They were happy with the new structures put in place and chose to continue to embed them as part of the culture of the organisation.
On the other hand, the results showed a significant decline (8%) in the score for Workload. This allowed them to renew focus on this area, and create an action plan for the next year that centred around reducing the time staff spend on tasks.
By embedding stakeholder feedback into the school improvement journey, you can ensure that you are focusing attention on the places that matter most, at the times that matter most.
Driving Staff Engagement
Continuous surveying and clearly communicating the outcome to your staff is a great way to let them know that you care and you hear their experiences, which often itself drives staff engagement. In fact, among the trusts who have taken part in our survey for each of the four years this survey has been running, responses to the question ‘How often do you see that the feedback to the school leadership has an impact?’ were, on average, 9% higher in the fourth year compared to the first. One large trust we work with achieved a 94% staff participation in their staff experience survey this year, compared to 41.4% when they started the process.
By showing you listen to your staff on a regular basis and demonstrating the clear impact of doing so (see section 3 for further information on this), you increase participation and belief from staff that they are heard and understood. Our research shows that if staff know they are heard this in itself is a major driver of wellbeing and retention. In addition, by frequently asking about topics that matter to the trust, you clearly communicate about the trust’s ethos – surveys are a two way street.
2) Getting Real Value From Your Results
As we’ve just discovered, repeating the same survey over time can have some real advantages. But that’s not all. To capture real insights from a survey, you need to look at the responses in context and compare them to other relevant responses. Why? Surveys are essentially trying to interpret human experience into scores, and the experience differs a lot across questions. 90% of staff being happy with their relationship with parents might be considered a high result but 90% of staff not experiencing bullying feels like a problematic result. So the relative comparisons and analyses are more valuable than just looking at the absolute figures. It is within the context of your responses, that you will be able to find more comparisons and interpret the results in ways that go beyond the figures and provide a real life understanding of the data.
Below is an example of our matrix data view, where you can see all of your trust’s average scores linked to the modules and questions they were responding to.
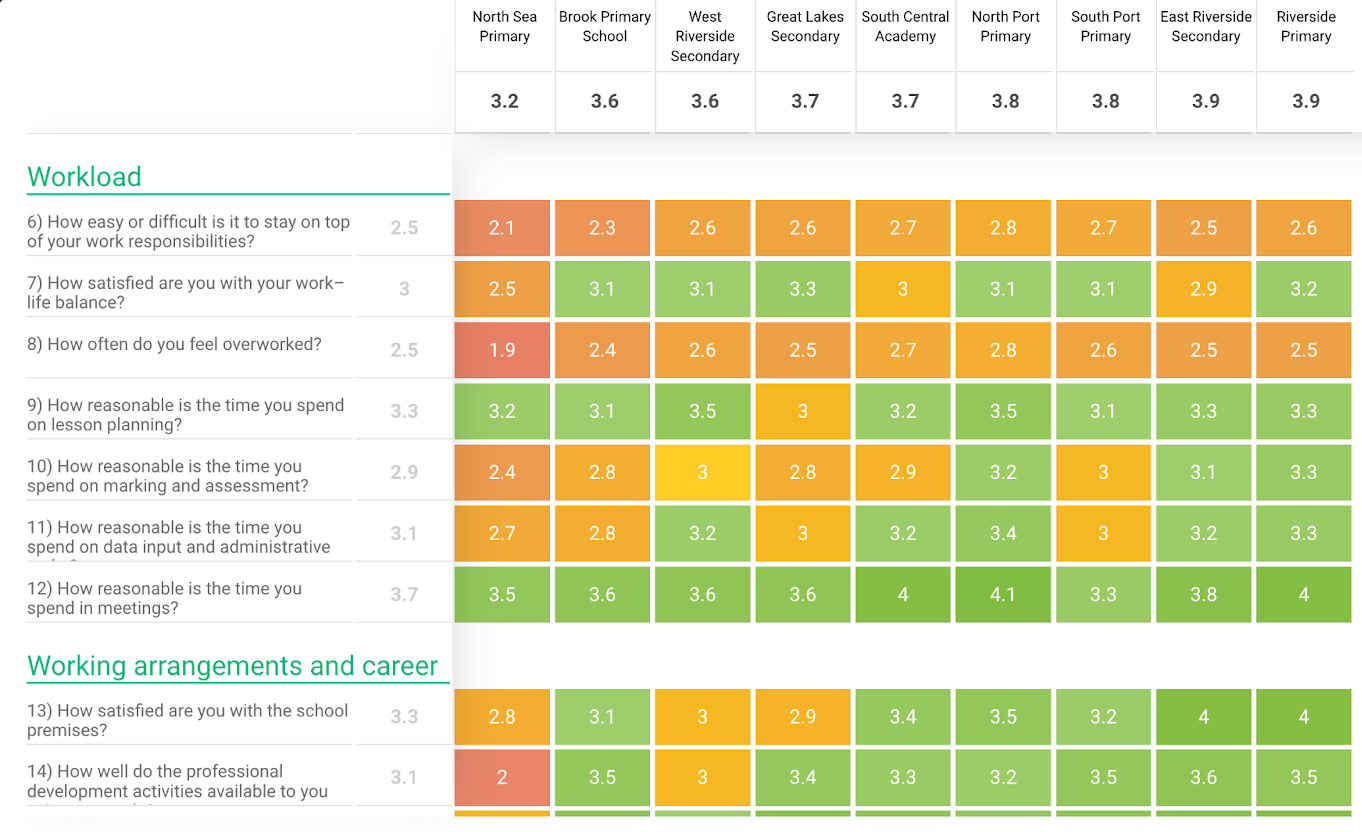
Our matrix data view with example data
Michael Cowland said, “While it’s great to see the obvious stuff, it’s the data behind the data I think that you really need to interrogate. Looking into the different areas of the survey and how results differ for each year, school, and in comparison to the national data helps you know which schools are struggling and which ones are leading the way.”
Here, we’ll investigate a few of the ways in which understanding your data in context can help you maximise the impact of your survey.
Comparing your Results Across the Trust
As a trust leader, surveying consistently across all the schools in your trust allows you to compare between schools and identify trends or areas of strengths and weakness. For instance, your trust overview may show that your trust’s lowest rating is for staff workload. However, looking deeper into the data, you may find that staff in one particular school are struggling in this area more than others. Or on the other hand, you may find this score isn’t representative of your whole trust, but is happening across schools in a specific geographical area.
Identifying what your trust already does well and what areas require improvement can allow you to understand your data in a broader context. You can look at where further actions can be taken and draw on what needs to be done – based on activities that have been undertaken in the areas your trust scores high. For example, when a trust can identify their areas of weakness and strengths, leaders can learn from the strengths, delve further into how/why they did well, and take note of what practices were used to make this area a strength.
Understanding how results vary across different schools in the trust allows you to implement good practice within their areas of improvement across the trust, by sharing knowledge from the higher-performing schools with those who are struggling in that particular area.
Comparing Between Groups
True focus on wellbeing means that all staff members can feel fairly treated and respected, regardless of their background. Relying on pure averages can hide critical detail on this. Our Equality, Diversity and Inclusion (EDI) report showed that staff with protected characteristics can have a very different experience. For example, out of the over 16,00 staff members we surveyed related to their EDI experience, 72% of staff felt all staff were treated equally in the workplace. However, when this percentage was split between groups with different protected characteristics, we could identify that only 62% of staff with a disability responded positively to this question, compared to 75% of staff without a disability.
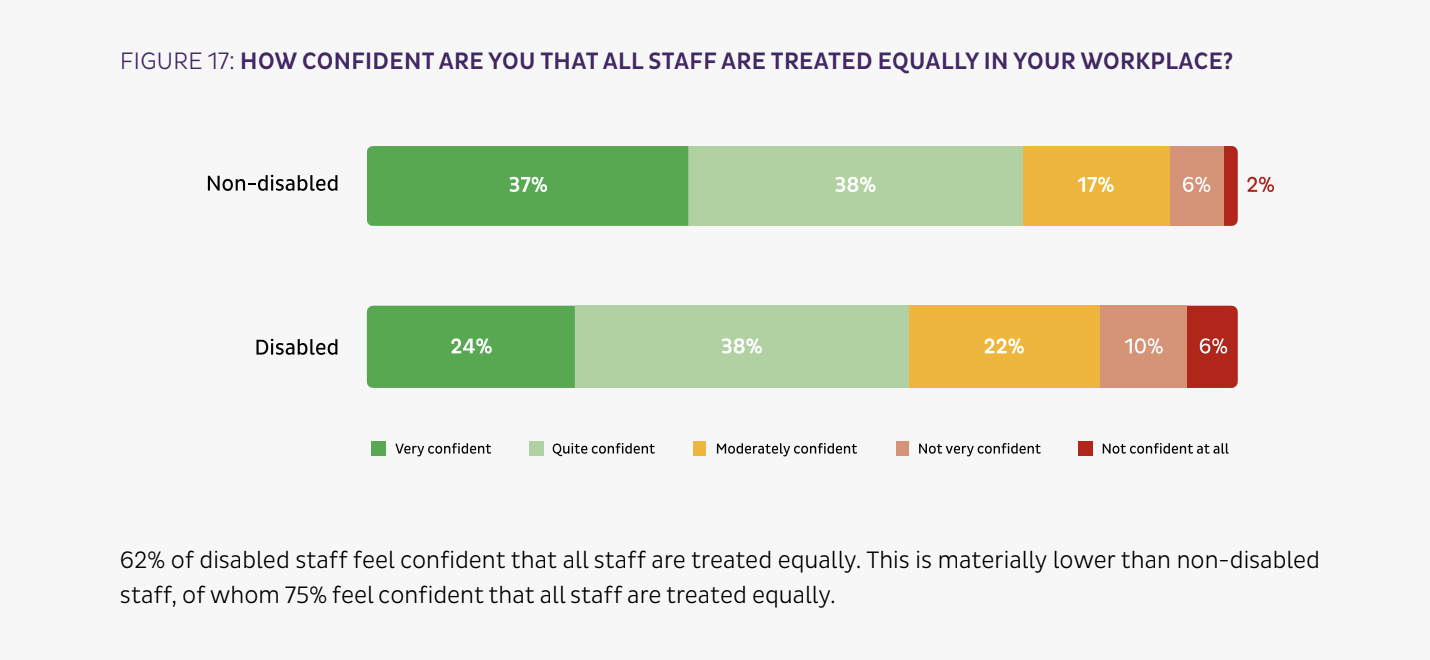
By delving deeper into the context of data, you’re able to see the full story. Although on average, staff members may feel they’re being treated equally in the workplace, it doesn’t mean everyone shares this opinion and experience.
Different staff groups also have different experiences based on their workload, role, and position in your wider trust. Our Trusting in Trusts report found that staff members who are not in a leadership position have less confidence that the trust adds value.
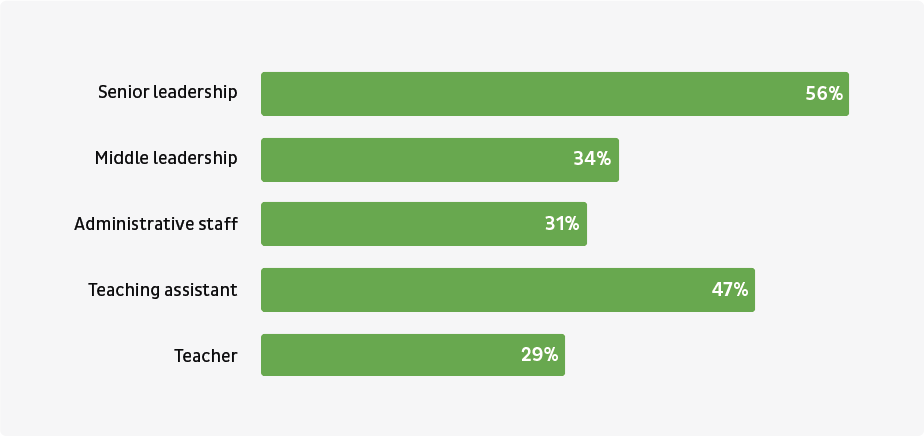
Responses to “Staff confidence that being a part of the trust is beneficial, by role”
This difference in opinion further highlights that staff members have different challenges and ultimately, a different experience within their school and trust. Making sure you can hear from all staff members and understand the nuance can help you strive to provide all staff members the same treatment and an experience you can be proud of as a leader.
Comparing your Results Nationally
When understanding your data it can also be useful to compare your own trust against others. At Edurio, our national benchmark allows you to understand whether or not your trust is performing in line with schools and trusts across England. For example, your trust’s workload responses may seem incredibly negative compared to the rest of your responses.
Product view with example data of our national benchmarking feature
But actually, if you look at the national benchmark and see all staff across the country share this workload problem, this changes how you perceive the data.
Further exploring your results both across your trust’s responses, individual schools and across the national data helps give you a much clearer picture of where you need to take action as a trust leader. For instance, if you were to see from your trust’s respondents that 39% of staff were thinking of resigning you may worry. However, if you were then to see the average nationally was 42% you may react differently.
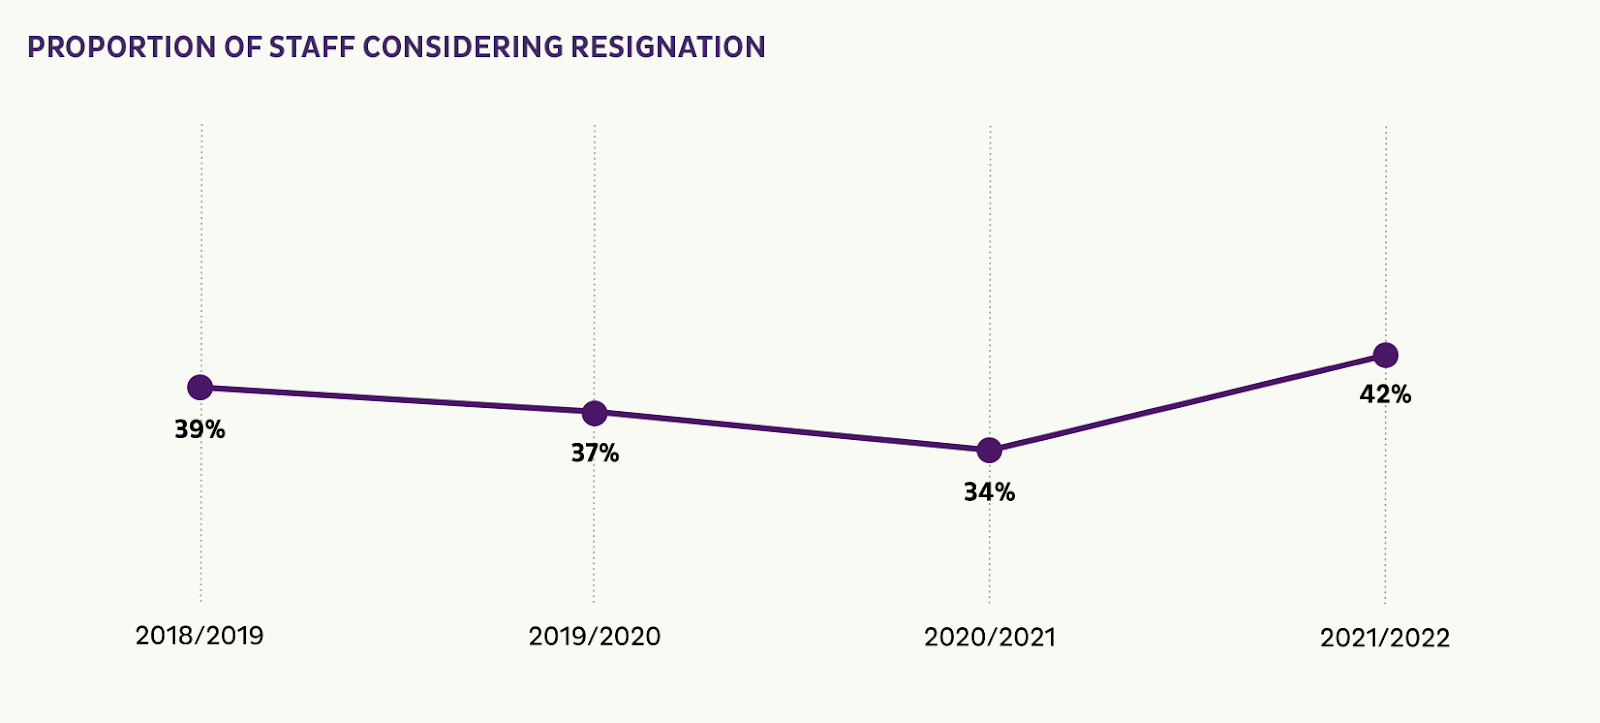
Instead of rushing to fix the problem, you may now view this data not as a problem within your trust, but as something that needs to be addressed nationally.
Even if you are not part of a nationally benchmarked survey like Edurio (you are of course very welcome to reach out if you’d like to be), you can offer schools the ability to benchmark themselves with the trust average or perhaps work with other trusts or partner schools to gather a comparable dataset.
3) Involve your Entire Organisation on the Journey
As part of your trust’s commitment to the long run and to get the most use out of a survey, you need to make sure that you involve the whole of your organisation: after all it’s their experience that you want to learn from and improve. We’ve found that among the trusts or schools who we work with, those who endeavour to involve their organisation during the strategic planning that comes after a survey, often get better outcomes.
Communicate Extensively
As a school leader, your use of communication is significant. In our interaction with trusts, trust leadership teams who clearly communicate the impact of their staff feedback are more likely to motivate staff and let them know they’ve been heard and understood. Without clear communication of why you’re undertaking this feedback journey and how it feeds into your organisation’s long term plans, the impact is less likely to be felt by your staff or seen in their engagement. Trusts we work with often find that staff feel more included on the journey if trusts:
- Say thanks
- Communicate what they’ve heard (covering both positives and areas for improvement)
- Share the actions they plan to take as a result
Empower School Leaders to Work with Their Results
Schools are unique and have different needs. As a result of this, in our work with trusts we’ve found that allowing leaders of individual schools to engage with their results often provides a better outcome. As a trust leader, you can guide them and set overall principles, but you need to understand what is relevant to them.
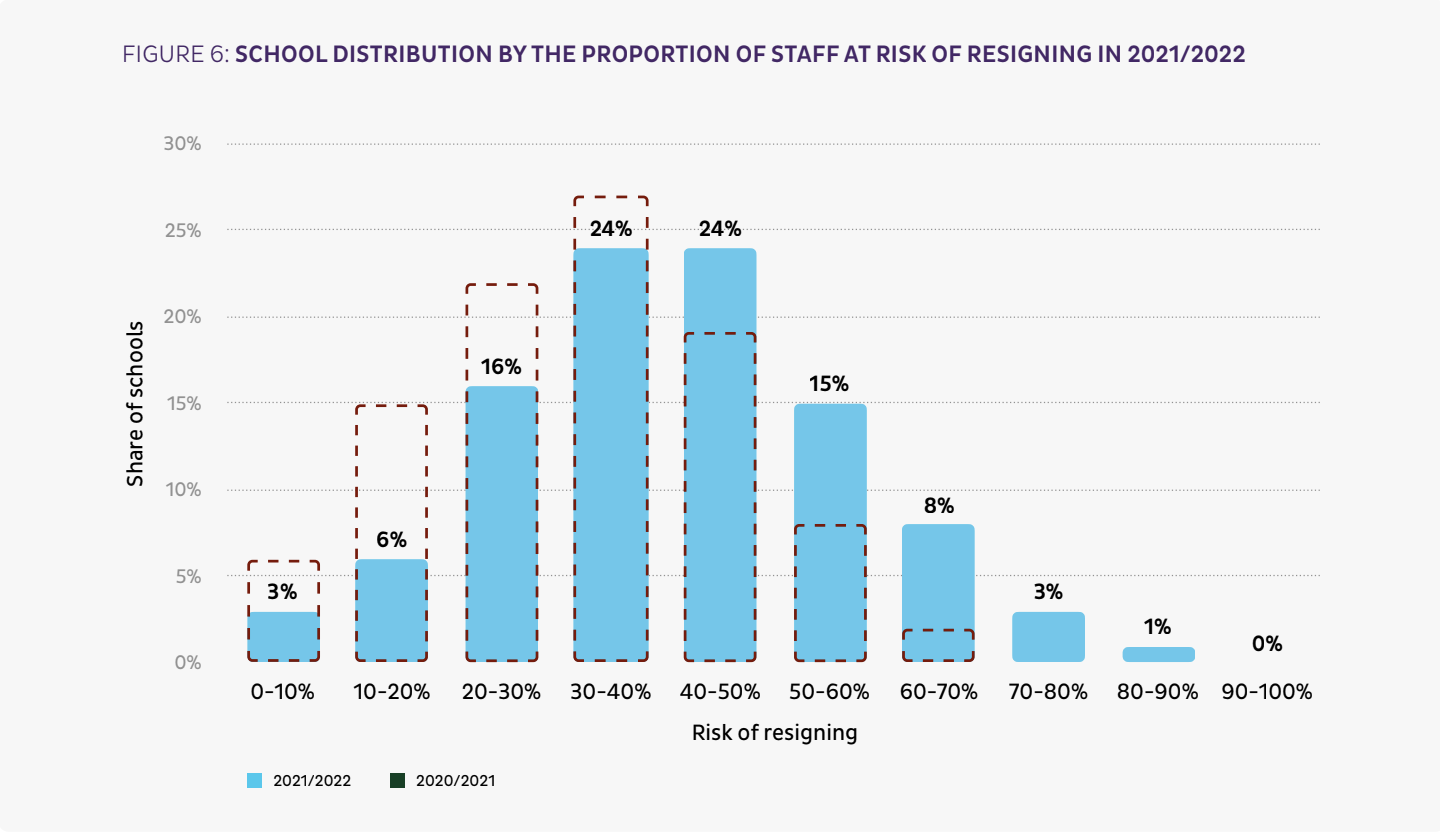
When looking at staff at risk of resigning, the picture differs massively between schools, meaning that the action needed post-survey should also be different to fit the school’s needs and environment. For instance, in our research on staff retention, we found some schools had 85% of staff thinking about resigning, and others had 0% of staff thinking of resigning.
In order to have full cooperation and investment from your trust’s staff, you must involve them in the action-taking process, which occurs after the survey’s results. The real work begins when the survey ends. We’ve found that trusts providing a consistent framework and letting schools discuss their plans together often leads to more useful/personalised solutions. In our work with over 100 trusts, we have often seen it’s not enough for you as a central trust team to go to each school with an instruction or an action plan post-survey. If trusts clearly define their vision and allow each school to create a local action plan from their survey results towards the greater trust vision, this will lead to more ownership and better interventions.
Not only does collaboration help provide your schools with the tools to tackle their issues, but allowing them to get together in committees within schools and across schools within a trust provides a community committed to the same purpose, which often generates better ideas and allows for the sharing of experiences. At Edurio, we often help facilitate this idea sharing between trusts at our roundtable events which offer trusts the chance to learn from others’ activities post-survey.