
What matters most to teachers when it comes to staff retention?
Since the launch of the Edurio Staff Experience and Wellbeing survey in the 2018/2019 academic year, we’ve collected over 110,000 school staff responses, exploring feedback from teachers and various other staff roles in schools. During this time, we observed how the proportion of staff considering resigning decreased during the years most heavily impacted by Covid-19, only to exceed pre-pandemic levels in 2022. This trend can also be seen in the Department for Education’s school workplace census. In this new report, we use our data to look at retention through the lens of the broader staff experience. Additionally, we provide insights for school and trust leaders whose work directly impacts staff wellbeing, recruitment, and retention.
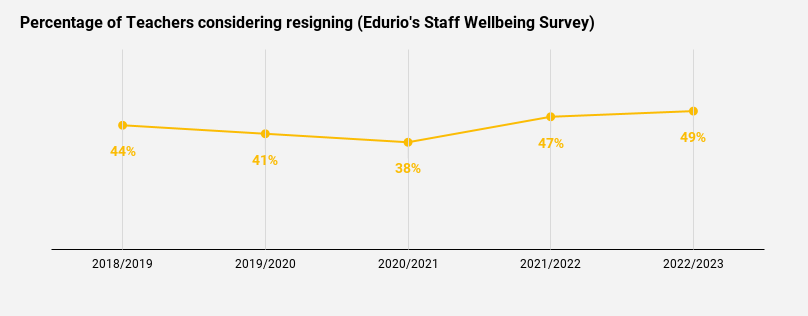
Teacher feedback: Teacher experience and findings relating to how often they have considered resigning in the last 6 months.
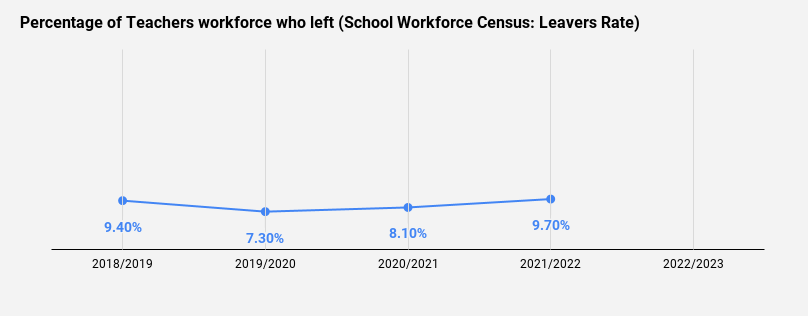
Teacher feedback: Graph showing teachers’ resignation rates.
As the graphs show, a notable increase can be seen in the number of teachers, who considered resigning in 2021/2022, as well as 2022/2023, compared to previous years. This also translates into rising numbers of teachers resigning. What’s more, unfilled teaching vacancies are also at a record high, with over 2,300 vacant posts in 2022/2023 – the highest number since the DfE began publishing the data in 2011.
Here, we will look at what day-to-day factors have the strongest correlation with teachers’ risk of resignation. Hence, we will focus on responses from teachers using teacher feedback from our surveys. It is important to note that the risk of resignation differs significantly between roles. Therefore, we explore who is most at risk of resigning and which elements of staff experience have the strongest relationship with resignation. To learn more about this, read our Staff Retention by Role report, where we explore other roles within schools and what matters most to each of them.
Get Your FREE Copy of Staff Retention by Role
Link to download our report: Staff Retention by Role
Teacher Feedback: How do teachers feel about factors of their day-to-day working lives?
We asked school staff questions related to day-to-day factors impacting their overall experience. Here we can see the average positive response percentages for each module.
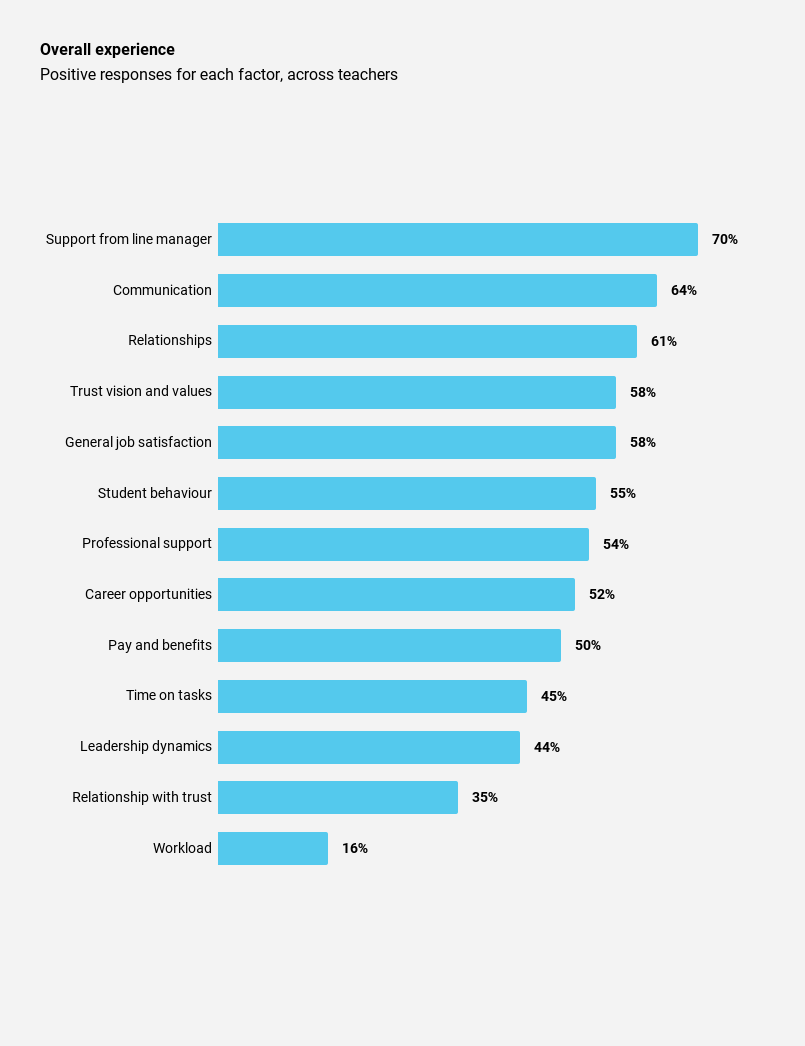
Teacher Feedback: What factors were teachers most positive about?
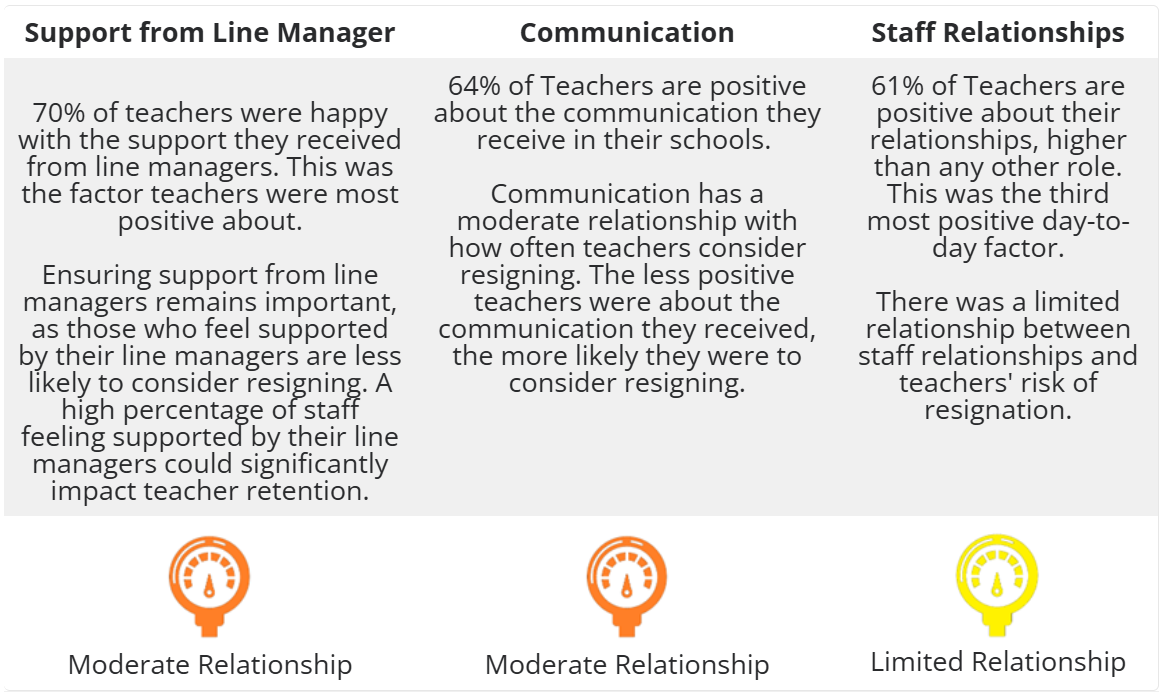
The top areas teachers were most positive about their overall experience were:
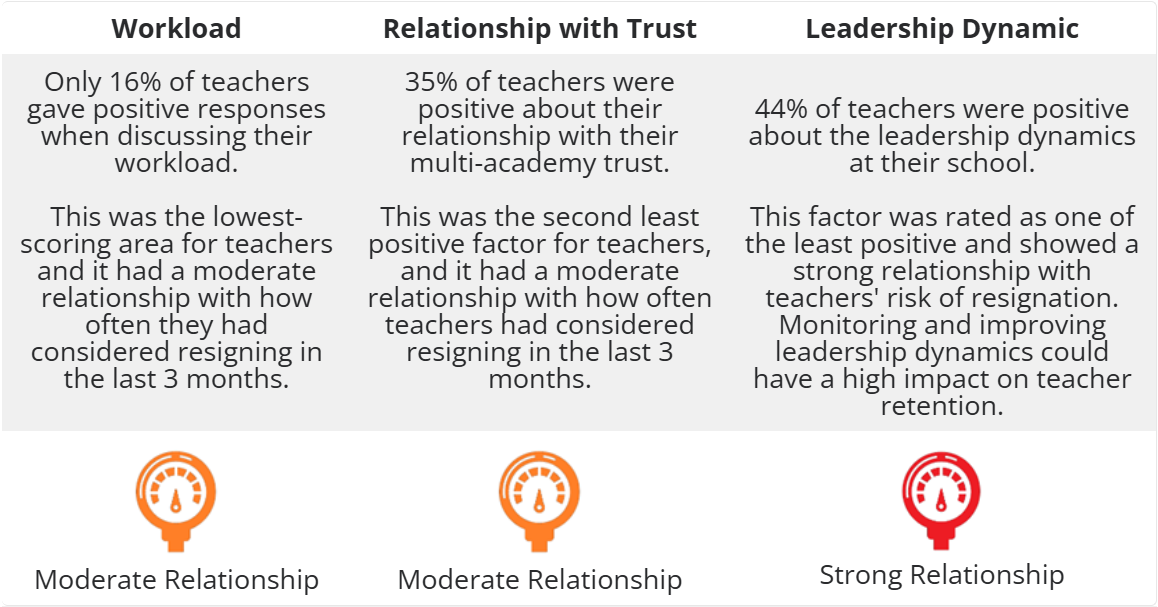
Teacher Feedback: What factors were teachers least positive about?
Teachers were least positive about the following three areas:
Teacher Feedback: Why do a Staff Experience and Wellbeing Survey?
As the data shows, much can be learned about the different staffing positions in your school or trust. Running a Staff Experience and Wellbeing Survey for your school or trust can provide insights into the overall feelings of your staff. Moreover, it can identify key strengths and improvements to help you understand what in your strategy works well. Additionally, it can highlight areas where you need to focus your efforts. Developing a strong people strategy for your organisation can save time and money, retain staff and see a happier, healthier community in your school or trust.

The Edurio Staff Experience and Wellbeing survey will help you better understand the key elements of working conditions and relationships. The survey provides insights into workload measures, professional support, career development, leadership dynamics, staff relationships, student behaviour, and other key factors. In addition, it can highlight a correlation between these factors and staff retention.
A goal that leads to action
Firstly, if you are considering a staff wellbeing survey for your organisation, we suggest starting with a clear goal of the impact you wish to make. Consider what changes you aim to see. Make sure the reason you’re doing a survey is aligned with your vision and values. It shouldn’t be viewed as just a “tick-box” exercise. Be committed to your staff’s wellbeing and work towards improving their experience.
Then, start planning for the survey. Take into account the schedules of your staff to ensure better-quality responses to your questions. Additionally, communicate your organisational goals and explain the reason behind the survey. Make sure also to explain what you hope to achieve with the survey. As a result, you may see higher participation and more forthcoming responses.
After Completion of a Survey

Once you have collected staff responses and feedback, look for positives and negatives. Be aware of any biases or other factors influencing your view of the data and consider other data sources to form better-informed conclusions. Before you share the results with staff, remember to summarise them. You could also consider organising a workshop. This way, staff members have an opportunity to contribute to the discussion and make suggestions about the next steps.
Finally, after concluding the results summary, you are ready to make an action plan to implement change. The plan should be aligned with your overall vision and strategy and include clear priorities of where you want to focus your efforts. To make sure you are still moving towards your goal, divide the work into different time periods, outlining what will happen. Subsequently, carve the change project into smaller steps. Try identifying some short-term, medium-term, and long-term milestones, as short-term wins are hugely important in encouraging people to keep going, while long-term milestones guarantee a system-wide impact.
Strategic Feedback Survey Cycle
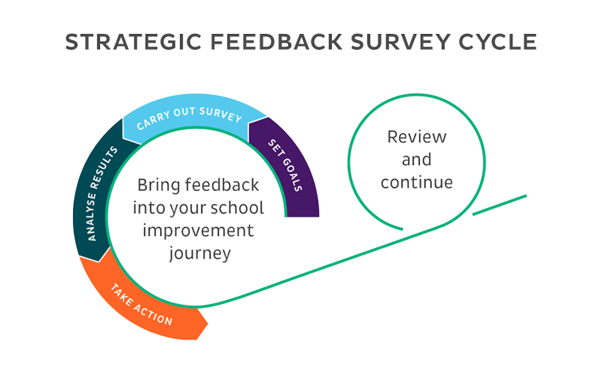
In our resource hub on school stakeholder feedback surveys, we will help you go through the steps of setting a goal for collecting stakeholder feedback, designing and implementing a survey, and guiding you through analysing and drawing conclusions about your survey results. While providing support for taking the next steps with the data you have collected.