
Stakeholder Feedback Hub
Empower your school leadership with this evidence-informed stakeholder feedback guide
Survey Analysis
Survey Analysis
Our platform empowers you to unleash the power of data analysis by transforming survey results into actionable insights. In this chapter, you’ll learn how to explore evidence and draw conclusions.
You’ve made it this far! Your respondents have completed your survey and the moment you’ve been waiting for has arrived – it’s time to find out what they said! Exploring the results of the survey can feel both exciting and daunting. Where do we begin? What do we do if we see results that are not what we expected? What does it all mean?
Survey analysis is essentially a process of asking questions about the data, and therefore it’s helpful to have a set of questions in mind. These questions should link directly to the purpose and goals of your survey. Asking questions helps us identify the data that gives us a clear picture of the situation.
An introductory clip
An introductory clip
Here’s an introductory clip from one of our webinars explaining how to start the survey analysis process. To access the full recording, click here.
View recording
How do we start analysing the survey results?
Start with a broad overview of the data you have. Looking through the entire data set, rather than immediately focusing on details will allow you to identify important patterns in the feedback and get a better understanding of your situation. The visual summary and accessibility of the results will depend on the survey platform you are working with. You may be someone who loves working with raw data and will export everything into a spreadsheet to start crunching numbers. Or, you may need to get your best data guru to help you. Possibly, you’re working with a platform that provides results visualisation.
Check out how Edurio visualises survey results!
No matter how comfortable you feel working with the results, start with an overview, looking at the bigger picture from which you can decide which direction to take when exploring the data in-depth.
As you go through the results, ask yourself these questions:
Which respondent group has the highest results?
(consider this only if you have grouped results by
respondent groups)
Are there any surprising results?
Which respondent group has the lowest results? (consider this only if you have grouped results by respondent groups)
Are there any surprising results?
#1Find the positive
Whether or not you are an optimist, don’t forget to highlight the positive results. This is a great way to celebrate what is working well in your school or trust. However, as you are just starting to explore the results and what they mean, note any questions or ideas about why these results are the way they are. What might you know or want to find out about the processes in place that would lead respondents to answer positively about these areas? Consider if there are specific respondent groups with higher results all around and ask yourself why that could be. You have identified the positive aspects, but let’s hold off still on rushing to conclusions about why they are so.
#2Face the negative with an open mind
It’s not always easy to face areas of weakness, but if we ignore them, there is no opportunity for growth. When looking through your results, take note of the areas that are the weakest or the groups that show the lowest results. Keeping an open mind, try not to jump to conclusions or explanations yet. Instead, note questions that will help guide your exploration of these results as you try to come to the root cause of why respondents responded that way. Working with a critical mind, do your best not to take the results personally and imagine viewing things from the outside to distance yourself from any biases you may have.
#3Look out for surprising results
If at any point you find yourself saying, “Oh, I wasn’t expecting that!” or feeling surprised by any of the results in your survey, note these questions down- whether the surprise is positive or negative. Perhaps you were expecting results in a certain area to be better or worse than they seem to be – these might be clues to areas where there is misalignment or misunderstanding among stakeholders and leadership. Make sure to discuss these questions later to see if other people on your team were equally surprised, or if they have any input on how things are.
#4Understand open response answers
If you included open response questions in your survey, decide how you want to go about analysing what people wrote. Open response questions allow respondents to provide free-form answers, which can result in a large amount of unstructured data that is difficult to analyse. These responses can add insightful nuance to the numeric scores of the rest of the survey, by giving clarity on how respondents understood questions, or by sharing examples of their specific experiences. Most significantly, open text answers let you hear the voice of your respondents – how they think about things and the language they use to think about these things. There are a few ways you can go about analysing the texts.
Look for patterns in the open texts. As you first browse through the responses, identify themes that seem to frequently appear and then count how many comments match each theme. This can be done manually by assigning a label to each response or by using specialised software designed to understand words that frequently appear together, synonyms, similar sentences, and so on. Once all the responses have been coded, you can analyse the data by examining the frequency of different codes, identifying patterns or trends within and across codes, and exploring relationships between different themes.
Word clouds are visual representations of text data that display the most frequently used words in a set of text. They are a quick analysis tool that gives a high-level idea of the most used words in responses. Word clouds need to be used in conjunction with other forms of analysis (such as coding) to provide a more complete understanding of the text data. Generate word clouds using a variety of online tools or software programs that allow you to input your text data and customise the appearance of the word cloud.
Consider using newer technology in your open response analysis, like ChatGPT. Enter the text into the chat and ask ChatGPT to look for specific patterns that interest you. After the analysis is complete, you can continue interacting with ChatGPT and ask for summaries, visualisations, or structured data output depending on the type of analysis performed and ask further questions about the data.
#5Consider the most important results to take further
Once you have explored the results of all questions and categorised the strengths and weaknesses of the results, you can start putting together an idea of which question results will be most important in guiding your next steps.
Compare what you see against your goal. Did the questions you identified as most important when designing your survey provide the information you needed to achieve your goal? These might include any questions that had disturbingly negative results that caught you off guard. Or, if you found positive confirmation in your results about a topic, these might be the most important to use for communicating going forward.
For example, with a health and wellbeing survey, if your goal was to improve the health and wellbeing of pupils, look to which year group rate themselves healthiest, and which rate themselves as feeling most unhealthy.
#6Make it a team effort
There are various ways to implement a collaborative team approach to analysing your survey results. First, you may want a smaller group of the leadership team to explore the results together. This will give you a sense of the leadership’s perspective. You may also want to create a more mixed team to look at the results, which will give you a broader range of perspectives and input when analysing the data. Leadership, middle leaders, and teachers may have quite different takes on what they see in the results and together you may be able to fill in any blanks more quickly.
How does this fit into our context?
Once you have finished the initial review of your results and organised strengths and weaknesses, having been mindful not to jump to conclusions, you can start filling in the picture around the meaning of the results. You want to put your survey results into the context of your school or trust and the context of your stakeholders. You may also want to compare your results to a broader set of data that might put your results in a completely different position than within your more local context.
Warning
Remember to be aware of biases
During analysis, it will be tempting to try to explain why respondents responded the way they did or even start thinking about who may have said what. Our minds jump to conclusions easily, as we are very good at finding patterns, creating stories, and then confirming our beliefs. As good as it feels to say, “Aha! I knew it! They are always the troublemakers!” or “Oh, that makes sense, since we just implemented a new policy- it must be working!” be mindful that you do not fill in the gaps too quickly. Explore other possible reasons behind your survey results, so you can draw well-informed conclusions.
#1Explore your survey results with other data sources
More often than not, one data source will not be enough to completely understand your situation and its root causes. That is why it is necessary to:
- Consider other data sources;
- Compare your sources;
- Find similarities and contrasting information;
- Explore one factor from your data source more deeply.
This is the point of triangulation, where we try to think of what other data sources might be able to give explanations for the results.
Think of this step as gearing up for supporting your argument. You have one data source (the survey) telling you one thing, it will be much more reliable and believable if you have other data sources pointing in the same direction. This is key for communicating the results and conclusions to others and vital for moving towards evidence-informed action and improvement.
Let’s take a look at some other data sources you could explore alongside your survey results:
- Other surveys
- Classroom observations
- Focused discussions
- Statistics about staff demographics
- Staff absences/sick day data
- Staff turnover, reasons for leaving
- Staff appreciation, support systems
- Ofsted reports
- Other surveys
- Focused discussions
- Statistics about parent demographics
- Parent-teacher, parent-school communication systems/strategies
- Parent events, attendance
- Parent view results
- Complaints
- Ofsted reports
- Survey respondents – staff
- Notes from staff meetings mentioning wellbeing
- Staff absences, sick days, etc.
- Staff turnover, reasons for leaving
- Pupil behaviour
- Staff appreciation, support systems
- Ofsted reports
- Other surveys
- Classroom observations
- Safeguarding and other behaviour incidents
- Focused discussions
- Statistics about pupil demographics
- Pupil attendance data
- Formative assessments
- Summative assessments
- Other pupil achievements
- Staff observations
- Policy analysis
- Ofsted reports
- Other surveys
- Vision/values communication strategy
- Regular communication strategy
- Town halls, attendance, results
- Ofsted reports
- Survey respondents – staff, parents, pupils
- Vision communication strategy
- Focused discussion with staff
- Town hall with staff, parents, pupils
- Behaviour policy analysis
#2Compare your results to benchmarks
Benchmarks are a great way to put your results into various contexts, comparing where you match up in comparison to a different group of information. As tempting as it is to see where you measure up against others, be mindful not to use benchmarks just for the sake of it. Use the benchmark just in the areas that are helpful to understand your goal.
If you have done similar surveys in the past, compare your current results to previous results to see if there have been any positive or negative changes. This will help you keep an eye on the progress you are making and if your action goals have brought the desired outcomes. For example, if you find some feedback scores might still be lower than you hoped, but you can see progress since before, you can be reassured that your actions are working. Or, if you see areas that stay along the benchmark where you know you haven’t put in any targeted effort, or areas that drastically change from the previous benchmark, you can react accordingly.
If you are working at a trust level, analysing survey results from a group of schools, consider your trust level benchmark as a way to compare how the schools within your network are performing. Where possible, allow each school to see their results in comparison to the trust-level average. This type of analysis will point out strengths and weaknesses within the group and be an amazing opportunity to open the discussion to share knowledge and practice on a trust level and for school-level staff engaged in improvement work.
Comparing your results to broader benchmarks that take into account national or regional trends, if those are available, will give you a different angle to analyse how your school or trust is performing. A result that might seem very worrying for your school may turn out to be something similar to the national level, indicating that it is a systemic problem, not just a local one and many schools are struggling in the same way. You may be able to identify areas where your school or trust is outperforming the benchmark, allowing you to feel confident that the processes in place are working well. On the other hand, you may see areas where your school or trust is below the benchmark, which may put additional pressure on these areas to be explored in greater detail to understand why. This also presents an opportunity for capacity-sharing at the system level; if you are outperforming in a particular area, what could other schools or trusts learn from you? What could you stand to learn from others?
Here is an example of how we visualise survey results and compare them to the national benchmark:
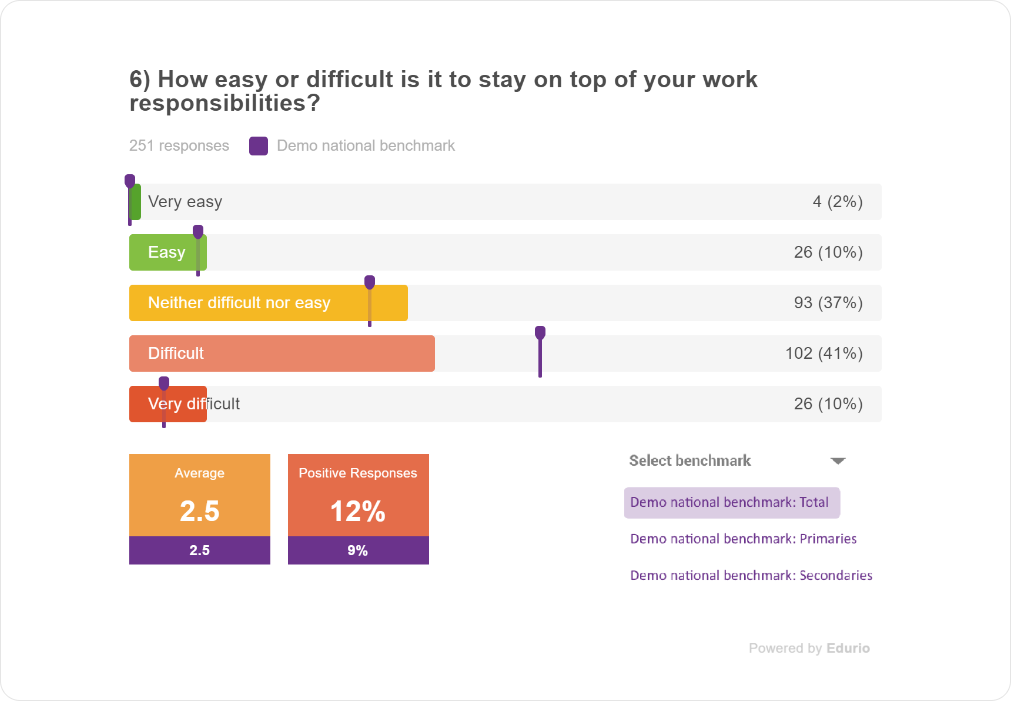
Check out our Insights page to find our extensive library of publications where we explore national trends on various topics in the sector through the lens of our surveys
#3Put the results alongside your specific context (stakeholders, key events)
Any given amount of variables could have affected the way respondents filled out your survey. Considering the stakeholders, key events and other possibilities will help you start to answer any questions you noted about your results. For example, a new head teacher trying out different work schedules for staff might be a contextual reason why one school’s workload results stand out among the rest.
Stakeholders
- Roles and relationships within the organisation at different levels
- Behaviours of stakeholders and the effect on the Environment
- Feelings of stakeholders, reactions to situations and decisions
Key events
- Everyday processes, practices, and habits that affect how things happen in your organisation
- Changes in the organisation that may disrupt (or have disrupted in the past) the environment and stakeholders
This is also the time to look at any demographic factors you included in your survey to see if a group with specific demographics differs from the average response.
Differences between subgroups – demographics, roles, locations, etc. can show various underlying factors influencing how stakeholders feel in the school environment.
For example, when we at Edurio were analysing the results from our Equality, Diversity and Inclusion staff survey, 80% of staff said their organisation is committed to EDI, which looks like a good result at face value. However, when we looked at the difference between the majority and marginalised groups, we uncovered the issue that there is an imbalance to this. So, although overall commitment to EDI is apparent, how people identifying with various marginalised groups interpret this commitment can be quite different.
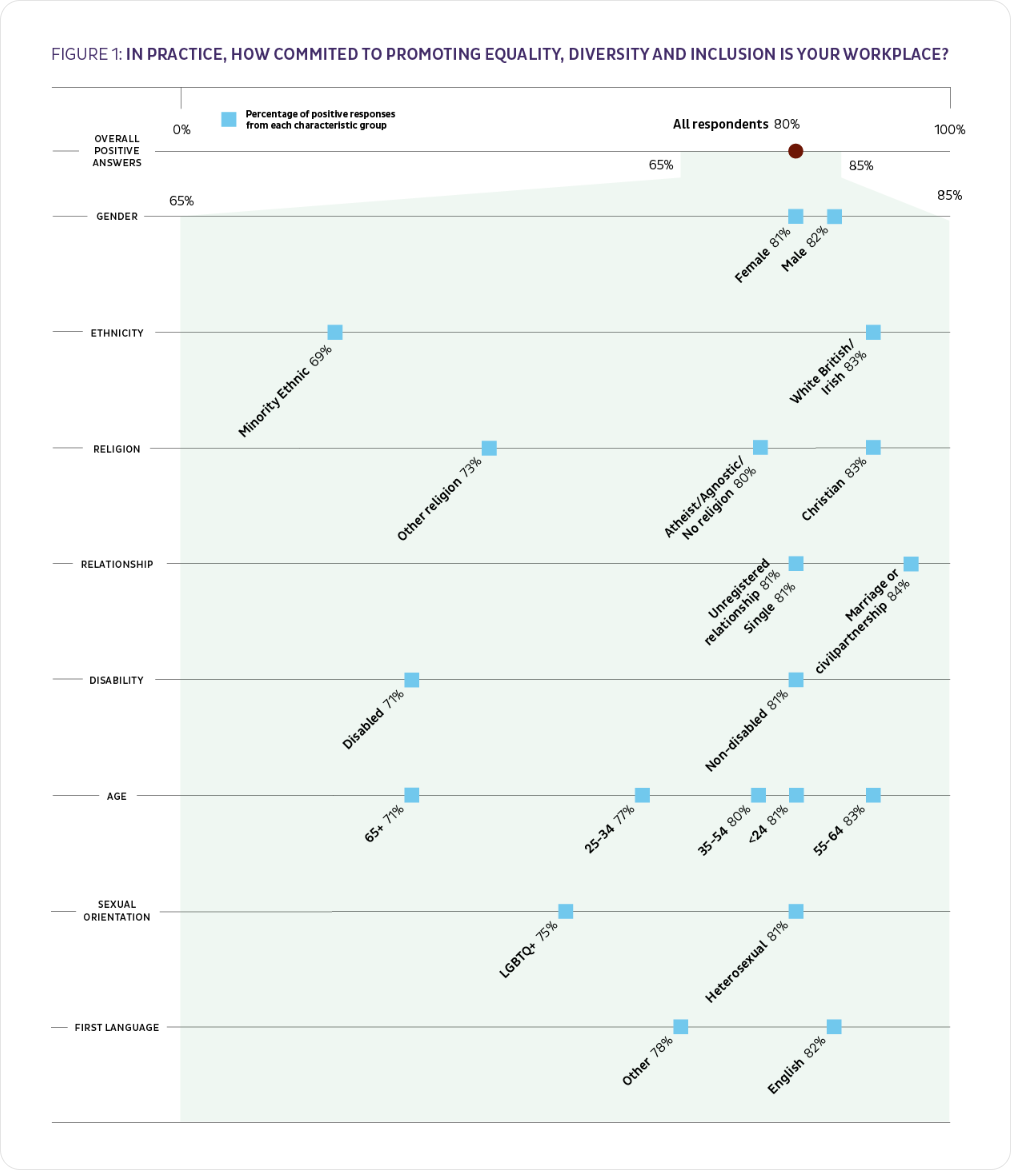
Take a look at the Edurio EDI Staff report
Drawing conclusions - What do the results mean for us?
Check back on your goal – WHY WHAT WHO
Although we hope you have been reminding yourself of the goal you set at the beginning of this process, if you have let it slip aside, now is the time to bring it to the forefront once again. Checking back to what you initially set out to find out about the topic and stakeholders, as well as why you decided to go in this direction in the first place, needs to be compared to what you now know. After analysing the results and considering other data points to explore, you can now confirm or deny your previous perceptions on this topic.
Finish your analysis by considering who would benefit from seeing what data, so that the communication of your results, which we’ll cover in the next chapter, is focused and actionable.
Key terminology
Change agent: Someone who is taking the time to study and guide the successful process.
SLT/Exec Representative: Senior Leadership Team, Executive Team. Depending on the structure of your school or multi-academy or single-academy trust, the leadership team structure may differ.
Stakeholder Representative: Staff, parent or pupil representing the group for your project
Materials & templates
Four informational summary resources accompany this chapter of the hub. You can share and adapt the materials by providing a link to the original documents and indicating if changes were made. You may do so in any reasonable manner but not in any way that suggests that Edurio endorses you or your use.
LETTER TEMPLATES
Introducing the survey
EMAIL TEMPLATE
Thank you email
POSTER TEMPLATES
Introducing the survey
POSTER
“Thank you for your feedback!”
All additional resources & templates are available for free: The page is password-protected; you may retrieve the password by completing the form above. After form completion, an email containing the password will be delivered to your inbox.
Share with friends and co-workers!