 Share
 Share
 Share
Many schools and trusts gather feedback from staff, pupils or parents in some form. Fewer have settled on the handful of measures that show whether things are getting better, and that leaders, trustees and governors can follow year after year.
This guide sets out the key questions we’d track for each group, with national figures for 2025/26 to compare against. They come from Edurio’s national datasets: more than 110,000 staff, 251,847 pupils and 80,000 parents across England.
Why a small set of KPIs matters
A full survey can run to dozens of questions. That detail is useful, but leaders, governors and trustees need a handful of measures they can follow over time. Pick a few per stakeholder group, track them every year, and compare them with similar schools. That turns survey results from a snapshot into a set of school improvement KPIs.
Staff: the measures to track
Staff experience drives retention and retention drives almost everything else. These are the measures we’d put in front of trustees and governors.
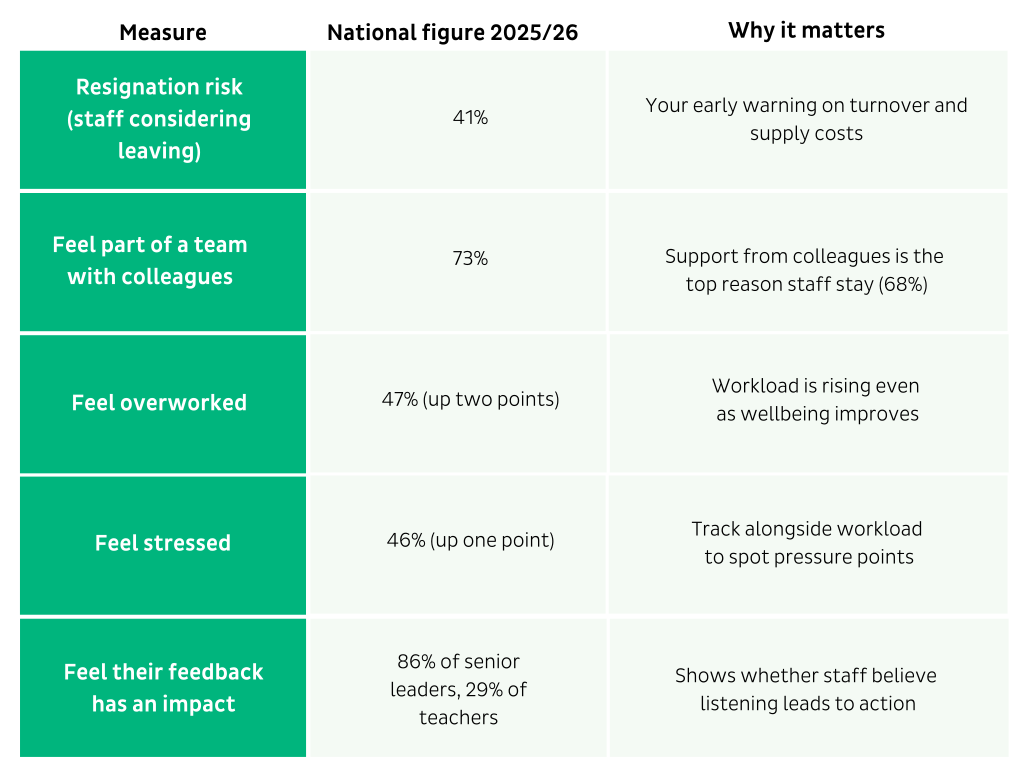
The last measure is the one to watch. A 57-point gap between senior leaders and teachers suggests many schools are listening but not showing staff what changed. Download the School Staff Experience Report 2026 for the full findings by role and phase.
Pupils: the measures to track
Pupil voice tells you what school actually feels like day to day. Figures below are for secondary pupils.
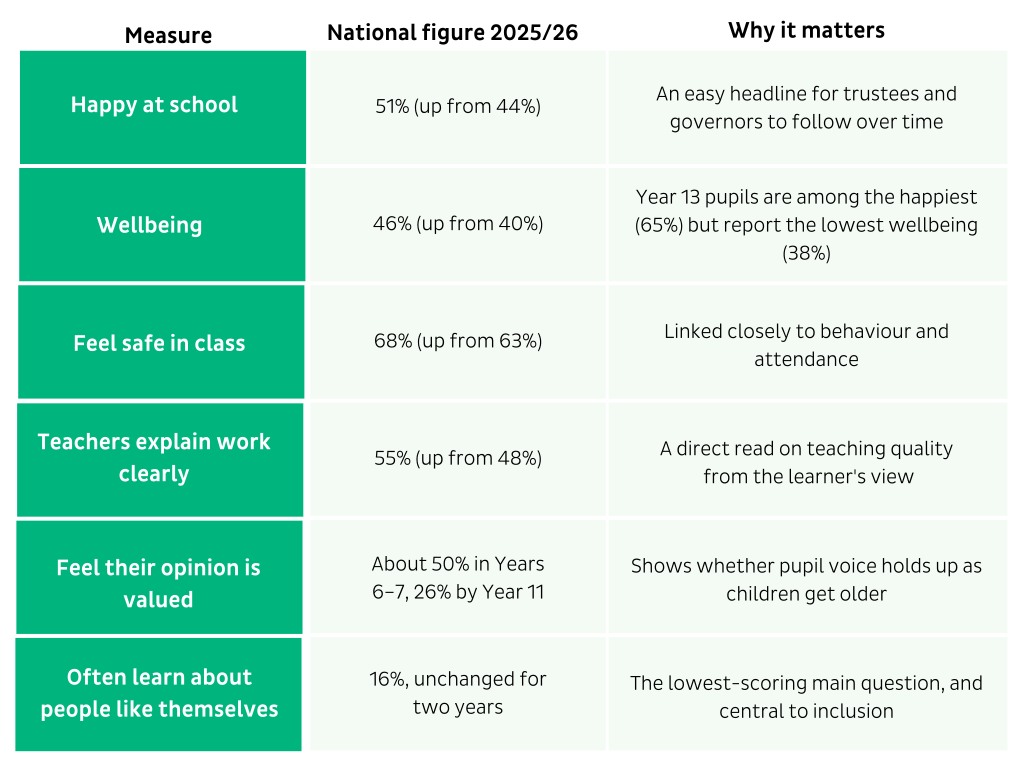
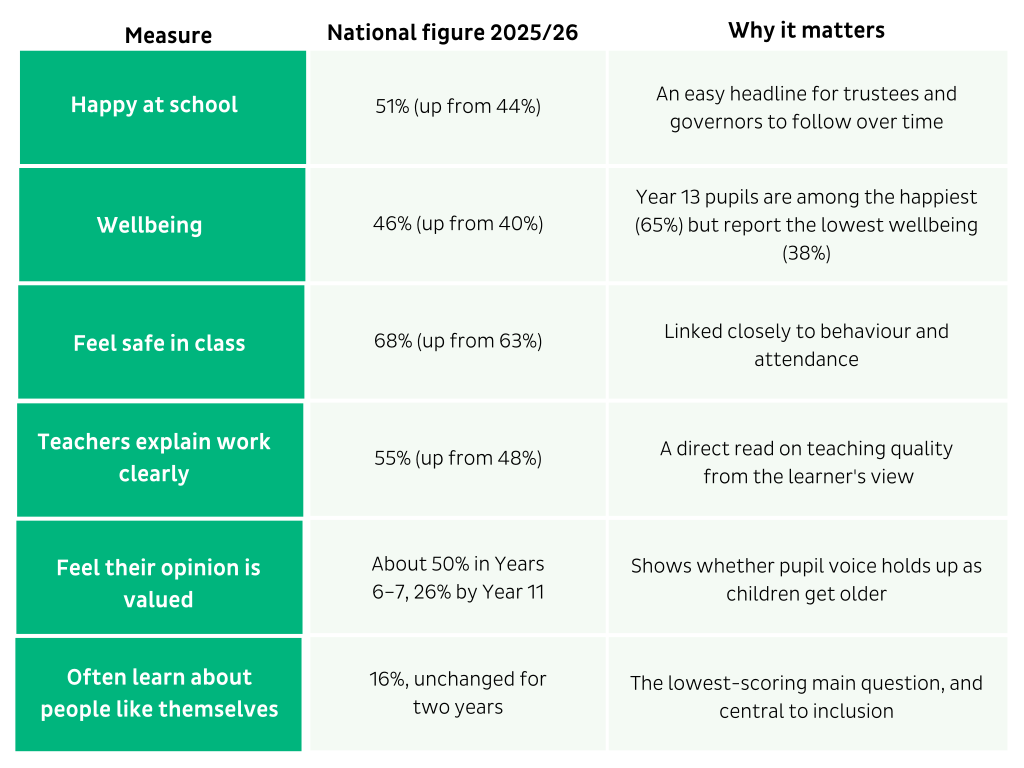
Tracking these by year group shows you where experience dips, so you know where to look first. Download the Pupil Experience Report 2026 for results from Year 3 to Year 13.
“For trust leaders, data like this gives us something incredibly powerful: a window into what school actually feels like for the children who experience it every day. And that matters, because the culture we think we have is not always the culture our pupils experience.”

Jonny Uttley
Strategic Consultant and founder of Jonny Uttley Education
Parents: the measures to track
These four measures cover the core of a school’s relationship with families.
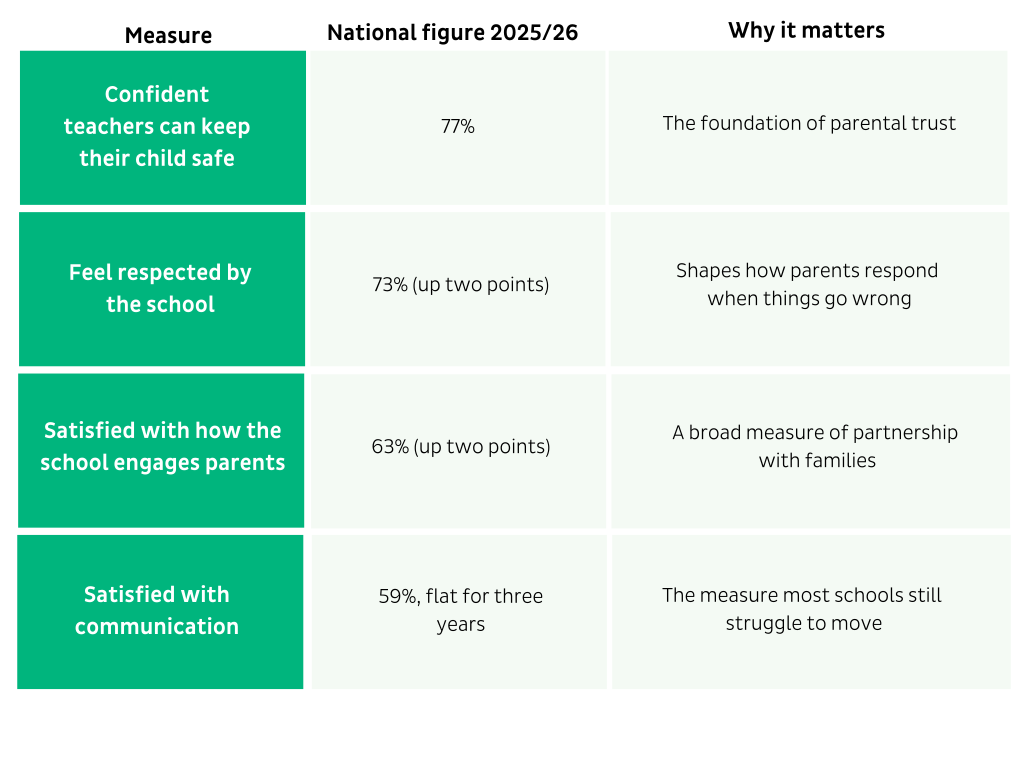
Compare primary and secondary separately. Primary parents are more positive on almost every measure, with gaps of up to 22 points. Download the Parent Experience Report 2026, and see our guide to communicating successfully with parents and carers.
“The strongest message in this report is that parents are not asking schools to reinvent the wheel. They want the basics of a good relationship with their child’s school to work well because they know this helps their children.”

Frank Young
Chief Executive of Parentkind
Adding measures of your own
The measures above give you a common core that you can compare with schools across England. Alongside them, you can tailor your surveys to your own setting. For example, you might add questions about your vision and values, a current priority such as a new behaviour policy, or something specific to your schools, such as specialist provision.
Picking one or two of these as KPIs as well means trustees and governors see progress on the priorities your trust has set itself, next to the nationally benchmarked measures.
Turning measures into improvement
The measures only matter if they change what you do. The schools and trusts that get most from surveys tend to follow the same habits.
- Compare every measure with similar schools. A 60% score means little on its own, but a benchmark tells you whether you have a problem or a strength.
- Ask the same core questions each year, at a similar point in the year, so you can trust that changes are real.
- Break results down by role, year group, phase or pupil characteristics. The gaps between groups are often where the work is.
- Tell staff, pupils and parents what you heard and what you’ll do next. This is the fastest way to lift the “my feedback has an impact” score.
- Put your KPIs alongside academic and attendance data in trust board and local governing body reports, so trustees and governors see the full picture.
For practical examples, see our best-practice guide on how award-winning schools act on feedback, the Listening Framework, and how pupil belonging, safety and wellbeing drive attendance.
Moving on from Kirkland Rowell or another survey provider?
If you’re moving on from Kirkland Rowell or another provider, a few steps protect your trend data:
- Download your past reports while you still have access.
- Note the themes you’ve tracked, and make sure your new surveys cover them.
- Run your first new survey at a similar point in the year to your last one.
- Treat year one as a fresh baseline, with national benchmarks as your reference point.
“We switched to Edurio because of their nationally benchmarked questions. Without external comparison, it’s hard to know whether the results we were seeing were actually how they appeared to be.”

David Harris
Engage Enrich Excel Academies
How Edurio can help
Edurio runs staff, pupil and parent surveys for more than 200 trusts and 2,500 schools, with every measure above benchmarked nationally. Schools can survey whenever suits them, and our team helps leaders turn results into action. See how King’s Leadership Academy Liverpool improved retention and saved around £240,000, or how Ted Wragg Trust became a listening organisation.
Book a demo to see how your school or trust compares.